Flexible alerting for ELK
For the past month, I’ve been working on my pet project - L3rt. It’s a very flexible alternative to Elastalert. The main idea was to replace yml configurations with Groovy DSL and create some simple web UI to create and debug rules. In this post, I’m going to show you what I’ve got so far.
Disclaimer
This application is under heavy development and can have bugs. Please use it with caution.Note
For all who is interested in participating in development or have brilliant ideas for the project's future, don't hesitate to submit issues and send pull requests. L3rtIn order to show you how it all works, I’ll be using this preconfigured docker-compose example of ELK stack. In this project, we already have all that we need for monitoring demonstration, the only we need to add is an alerting tool.
Open docker-compose.yml and add the following service:
  l3rt:
    image: dimafeng/l3rt:0.1.5
    ports:
      - "8080:8080"
    networks:
      - elk
That’s it! Now we’re ready to check how it works.
Execute $ docker-compose up -d to start all docker containers. Great, we just need to load some logs to our monitoring system.
$ nc localhost 5000 < /path/to/logfile.logIf you want to make sure all data is there, you can set up Kibana index patterns using this instruction. But I skip this step for now.
Web playgroud
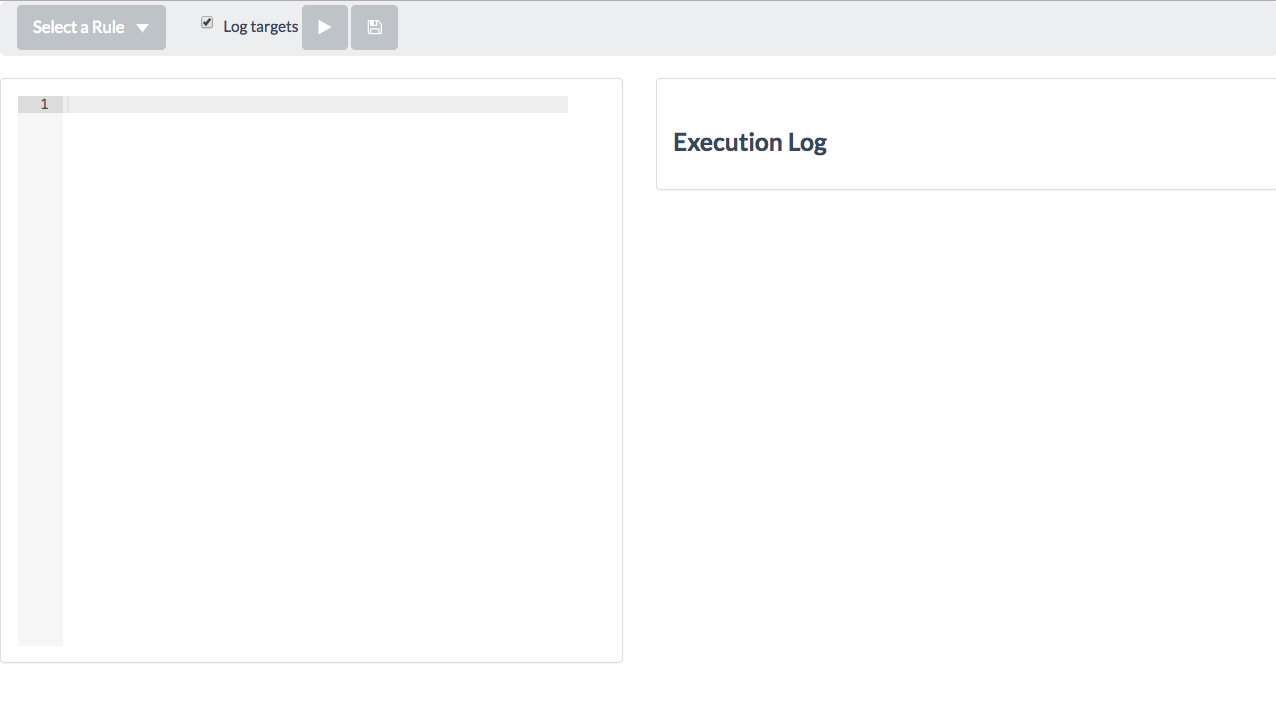
Open http://localhost:8080 in your browser. You should see something like this:
Now we can write some rules. The most basic rule is a query rule. Let’s say, we want to retrieve messages that contain a sentence “Service started”.
rule {
    ruleName = "myTestRule"                         // (1)
    params = [
            index: "logstash-*",                    // (2)

            query: [                                // (3)
                query: [
                            bool: [
                                must: [
                                        ["match": [ "message": "Service started" ]]
                                    ]
                            ]
                        ]
                ],

            config : [                              // (4)
                    sources: [
                            ["url": "elasticSearch:http://elasticsearch:9200"]
                    ]
            ]

    ]

    reaction { messages ->
        log(messages)                               // (5)
    }
}
Let’s take a look at what the rule consists of.
- You should name your rule. The name will be used for storing of rule execution metadata.
- This is an index that will be used for querying. By default, Logstash is using indexes
logstash-*. - It is an ElasticSearch query. You can read more about ElasticSearch search API here
- Since we haven’t specified config (yet), we need to define an ElasticSearch connection.
- Let’s just print the result as a log message for now.
In my case, I see the following messages:
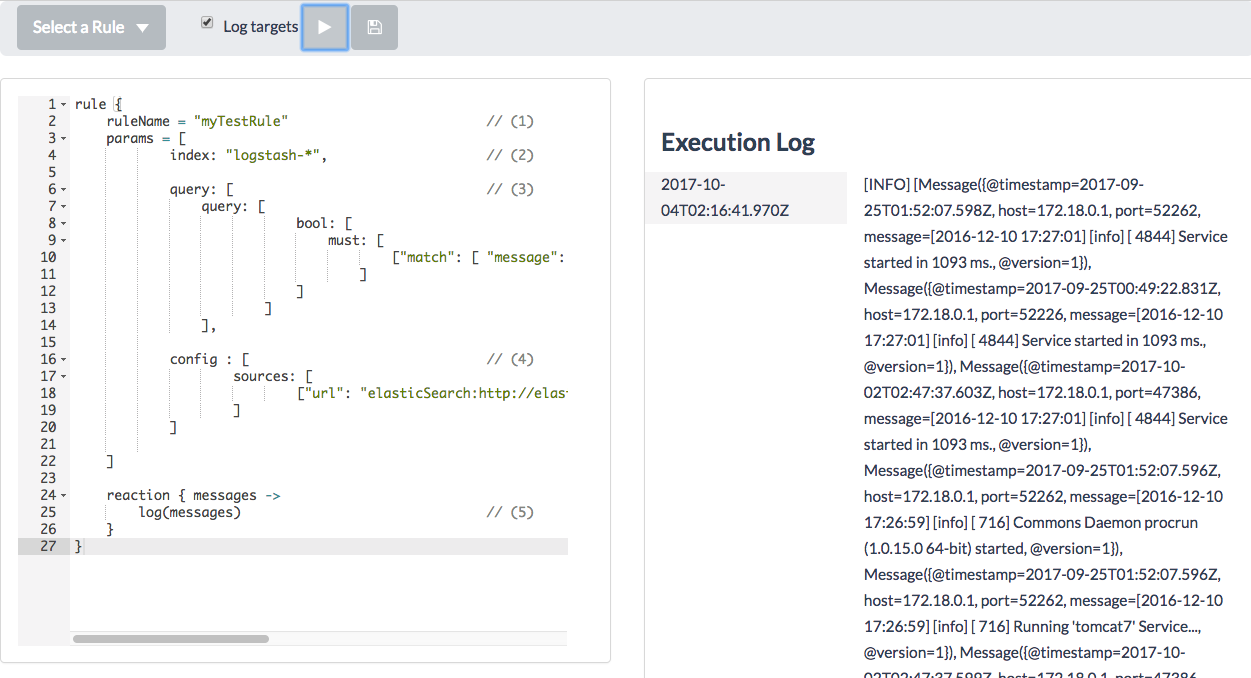
It prints all messages matched by the query in a raw format. Now we would want to extract message data and send it to some real target. First, say we have a message that looks like 2016-12-10 17:27:01] [info] [ 4844] Service started in 1093 ms. and we want to retrieve an integer value of milliseconds and depending on that value we’ll be sending or ignoring the message.
How to extract that value - since the rule is just a groovy based script we can use all the JVM power.
def regex = "(?s).*Service started in (\\d*).*"
if(it.data.message.matches(regex)) {
    def startTime = it.data.message.replaceAll(regex, "\$1").toInteger()
    ...
}
Now, if the value is greater than 1000 then we send a notification to a DevOps by email. If it’s greater than 2000 we send an email to DevOps and a HipChat message to a public room of our company. Otherwise, we ignore it. It can look as follows:
    reaction { messages ->
        messages.forEach {
            def regex = "(?s).*Service started in (\\d*).*"
            if(it.data.message.matches(regex)) {
                def startTime = it.data.message.replaceAll(regex, "\$1").toInteger()
                if(startTime >= 2000) {
                    email("devops@company.com", "Enormous starting time", "${it.data.get("@timestamp")}: Enormous starting time detected - ${startTime}")
                    hipchat("Notifications", "Enormous starting time detected - ${startTime}", "RED", true)
                } else if (startTime > 1000) {
                    email("devops@company.com", "Starting time warning", "${it.data.get("@timestamp")}: Starting time is out of normal - ${startTime}")
                }
            }
        }
    }
After rule launch you’ll see:
2017-10-04T01:05:56.096Z[INFO] Email: recipient=devops@company.com subject=Enormous starting time body=2017-09-25T00:49:22.831Z: Enormous starting time detected - 2093
2017-10-04T01:05:56.096Z[INFO] HipChat: room=Notifications message=Enormous starting time detected - 2093 color=RED notify=true
Real configuration
L3rt didn’t send real messages, it printed debug information to the log. In order to send real messages, we have to configure targets.
Let’s create a config file ./l3rt/conf.json:
{
  "sources": [
    {"url": "elasticSearch:http://elasticsearch:9200"}
  ],
  "targetSettings": {
    "mailServer": {
      "host": "smtp.gmail.com",
      "port": "465",
      "auth":  true,
      "username": "myemail@test.com",
      "password": "password"
    },
    "hipchat": {
      "accessToken": "...",
      "baseUrl": "https://api.hipchat.com/v2/"
    }
  }
}
And modify compose file as follows:
  l3rt:
    image: dimafeng/l3rt:0.1.5
    ports:
      - "8080:8080"
    networks:
      - elk
    volumes:
      - ./l3rt/conf.json:/l3rt/config/config.json
Now we can restart all services and start from the beginning - load some rules and run the rule. If all have been configured correctly, you’ll get real notifications to your email and hipchat room. You also can remove the config section from the rule declaration since we have it in the permanent configuration file.
Rule execution metadata
The last thing we haven’t accomplished yet is preventing the rule to retrieve the same data each execution. If you take a look at the query, you’ll notice that each time this rule is executed, the same query is generated, hence each 5 seconds you’ll be receiving the same messages. To ignore old results, we have to explicitly specify what ElasticSearch records should not be taken into account. This can be achieved by using lastSeenTimestamp. It’s a variable that is available within the rule which contains the last timestamp seen during the previous rule execution.
The final rule would look like this:
rule {
    ruleName = "myTestRule"
    params = [
            index: "logstash-*",

            query: [
                query: [
                            bool: [
                                must: [
                                        ["range": ["@timestamp": ["gt": lastSeenTimestamp]]],
                                        ["match": [ "message": "Service started" ]]
                                    ]
                            ]
                        ]
                ]

    ]

    reaction { messages ->
        messages.forEach {
            def regex = "(?s).*Service started in (\\d*).*"
            if(it.data.message.matches(regex)) {
                def startTime = it.data.message.replaceAll(regex, "\$1").toInteger()
                if(startTime >= 2000) {
                    email("devops@company.com", "Enormous starting time", "${it.data.get("@timestamp")}: Enormous starting time detected - ${startTime}")
                    hipchat("Notifications", "Enormous starting time detected - ${startTime}", "RED", true)
                } else if (startTime > 1000) {
                    email("devops@company.com", "Starting time warning", "${it.data.get("@timestamp")}: Starting time is out of normal - ${startTime}")
                }
            }
        }
    }
}
Running the rule in background
Since we have our rule done, we would want to start using it in background. To do so, we just need to save the rule. Click save button and type a name. That’s it! Now the rule will be executed automatically in background by timer (by default, each 5 seconds)
What’s next?
- If you practice Infrastructure-As-Code approach, you would probably prefer to mount existing folder with rules to your container. It’s easy to do - just mount it to
/l3rt/rules/ - Take a look at other rules. For now, I have got just one more - Count Rule
- Contribute your fixes or features
You can find the configured docker compose file used in the article in this github project.